
Dashboard
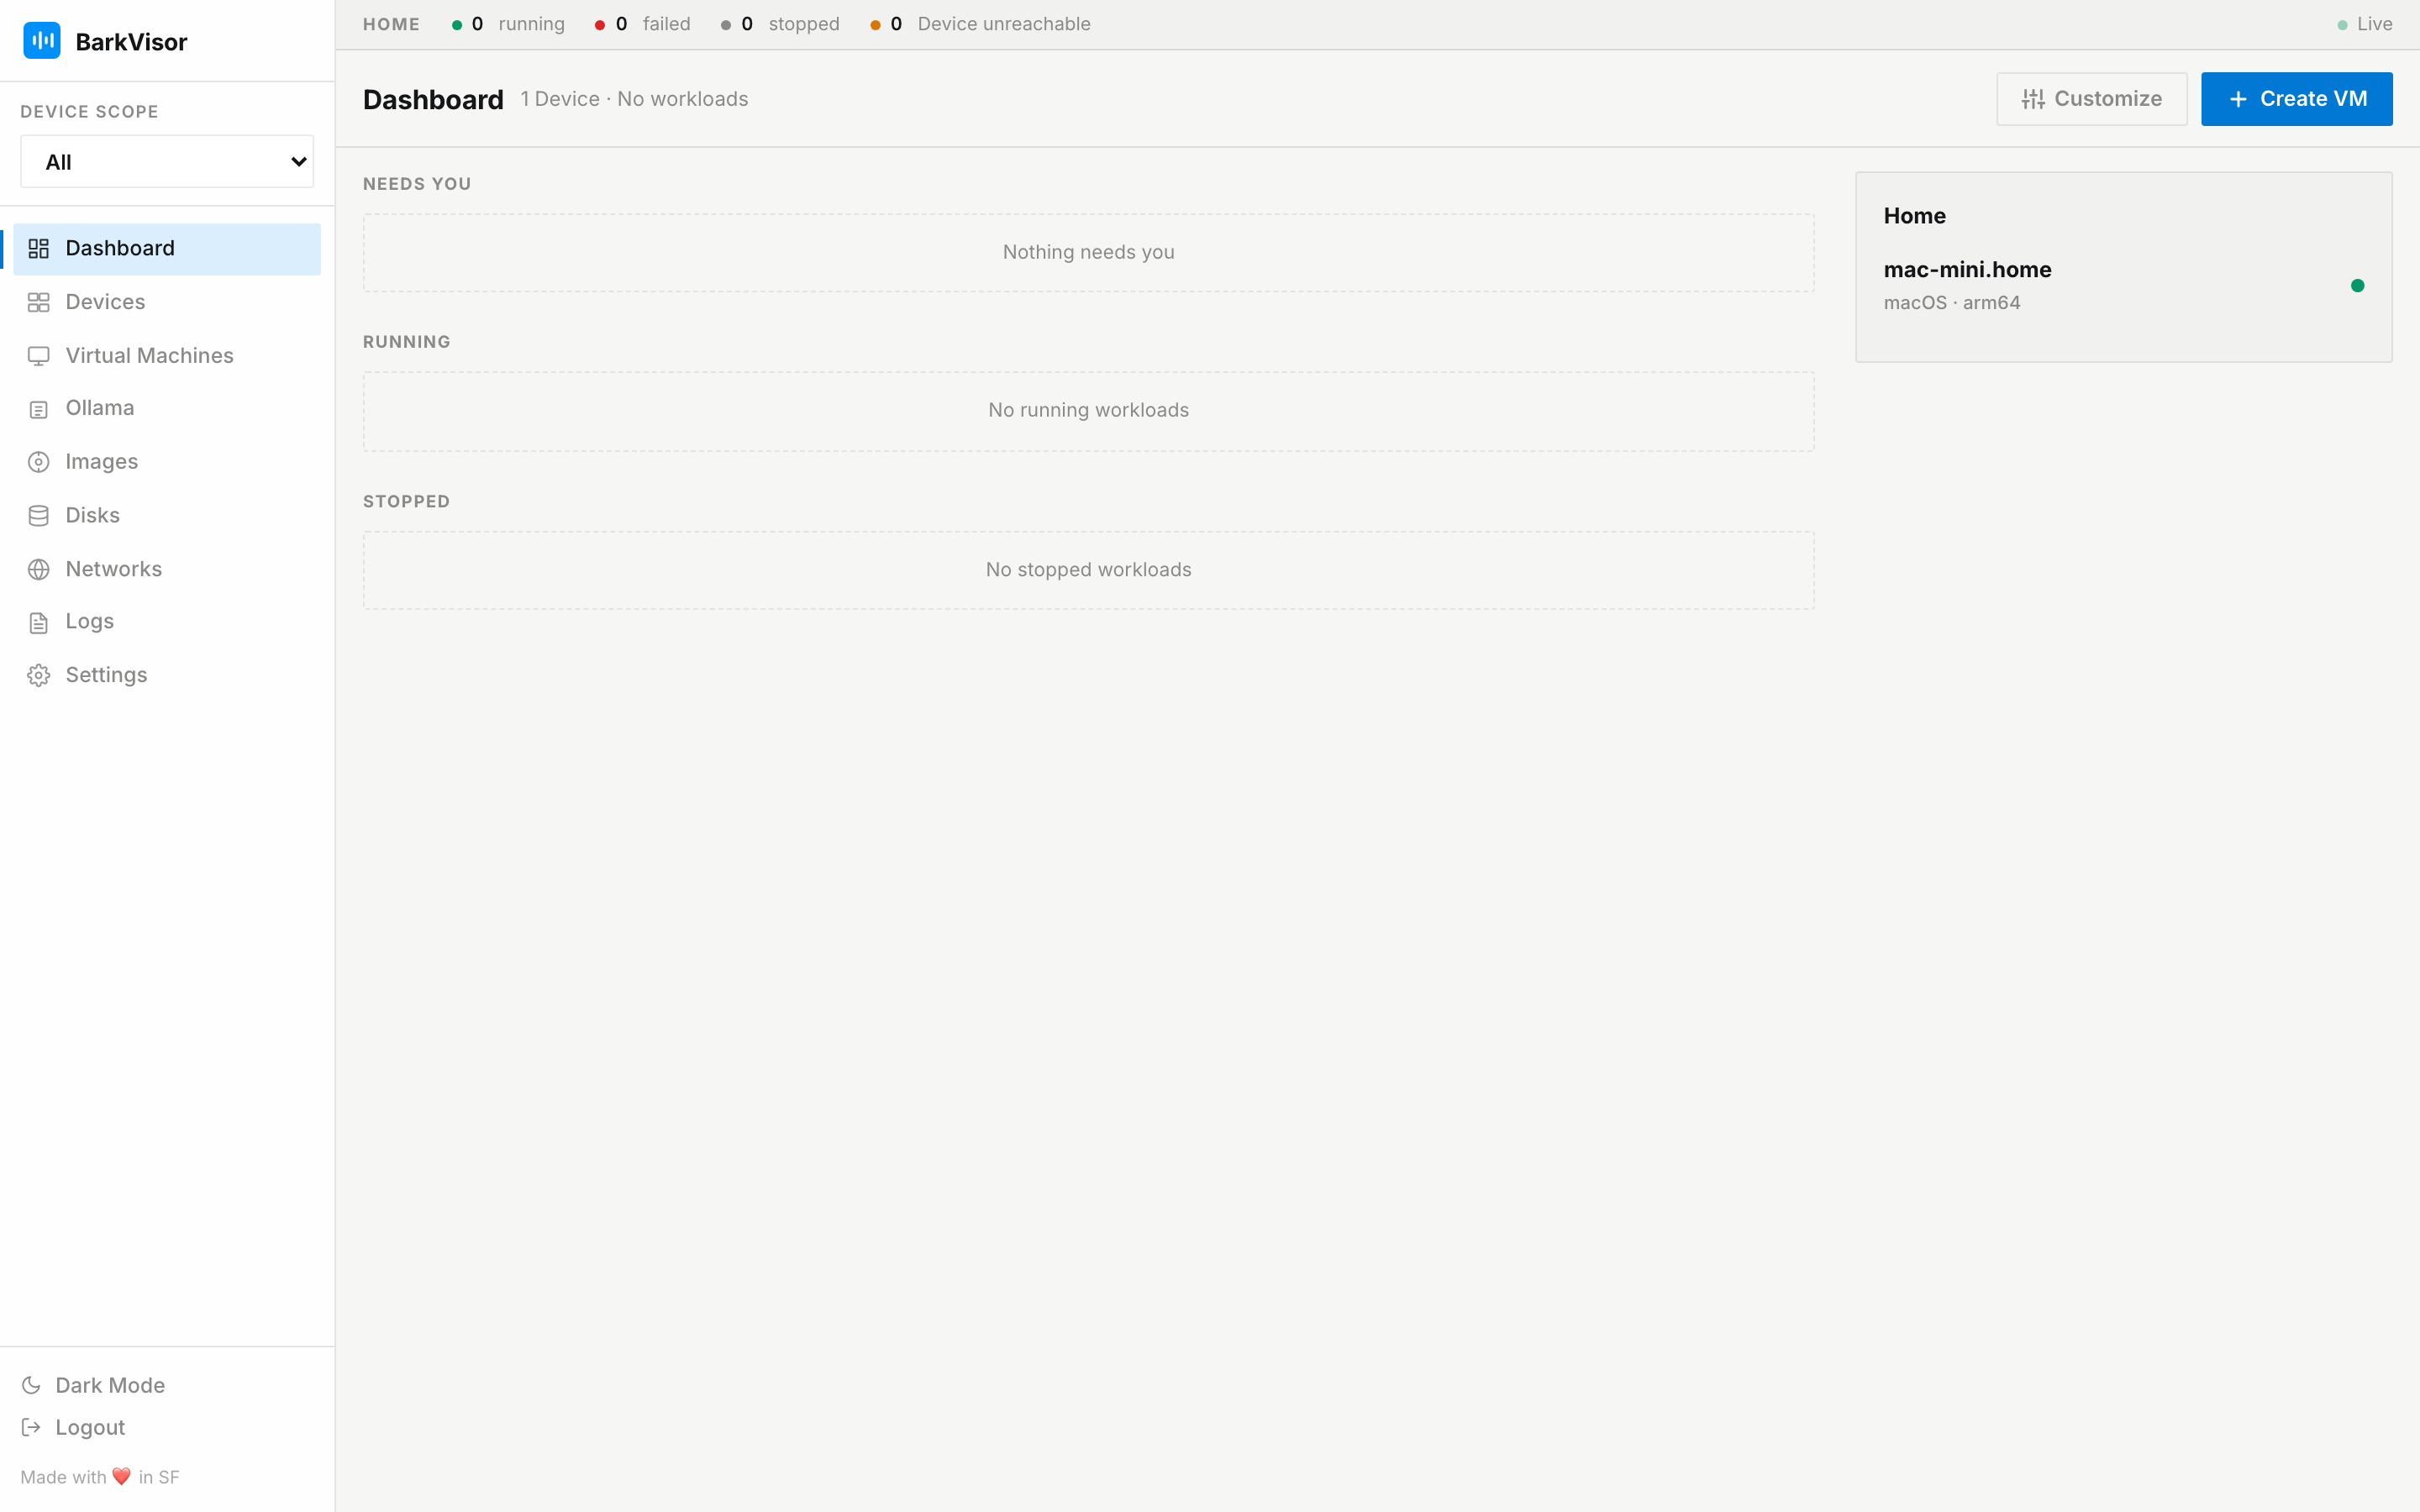
The Dashboard shows workloads, Device status, and problems that need attention.
Problems and workloads
Section titled “Problems and workloads”Failed workloads and unreachable Devices appear as incidents. Click Open to inspect the affected item.
Workloads are grouped into Needs you, Running, and Stopped. Running and Stopped sections appear when they have items. Each workload shows its Device; click it to open its details.
The side panel shows Home Device status and available usage information. Open Devices for detailed CPU, memory, storage, and GPU readings.
Customize the page
Section titled “Customize the page”Click Customize to show, hide, or reorder modules. Use Move up and Move down, then Done. The layout is saved in your browser.
Create a VM
Section titled “Create a VM”Click Create VM to choose an OS and a Device. See Create your first VM.